Michael J. Radzicki. Ph.D.'s Profile

Number of items: 19
Date joined: Apr 07 2021
Michael J. Radzicki. Ph.D.'s Work
#1
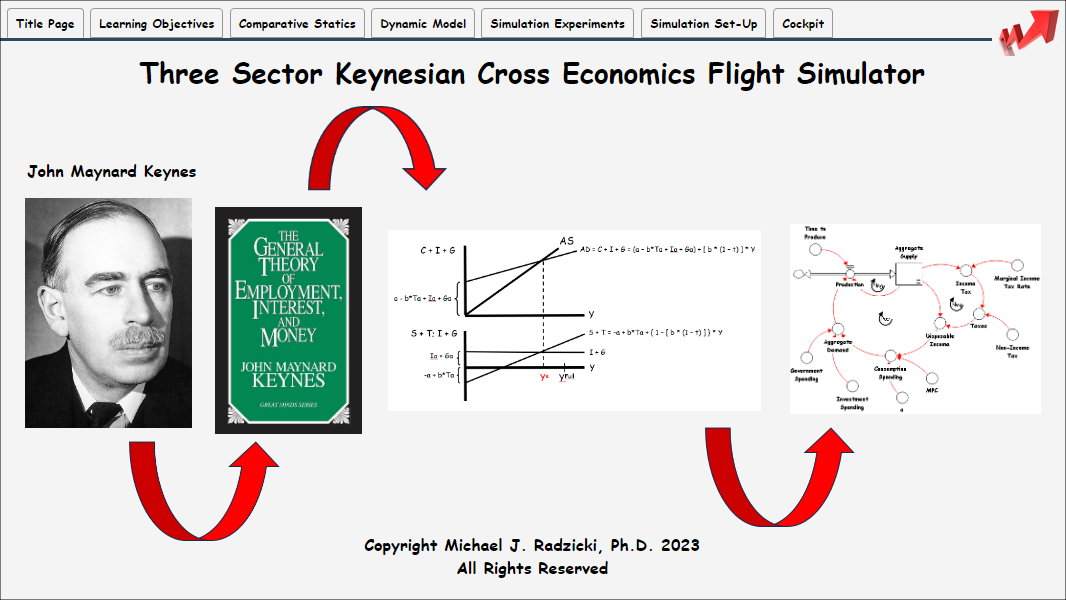
Three Sector Keynesian Cross Economics Flight Simulator
sim
⋮ 554 runs
Economics
Education
#2
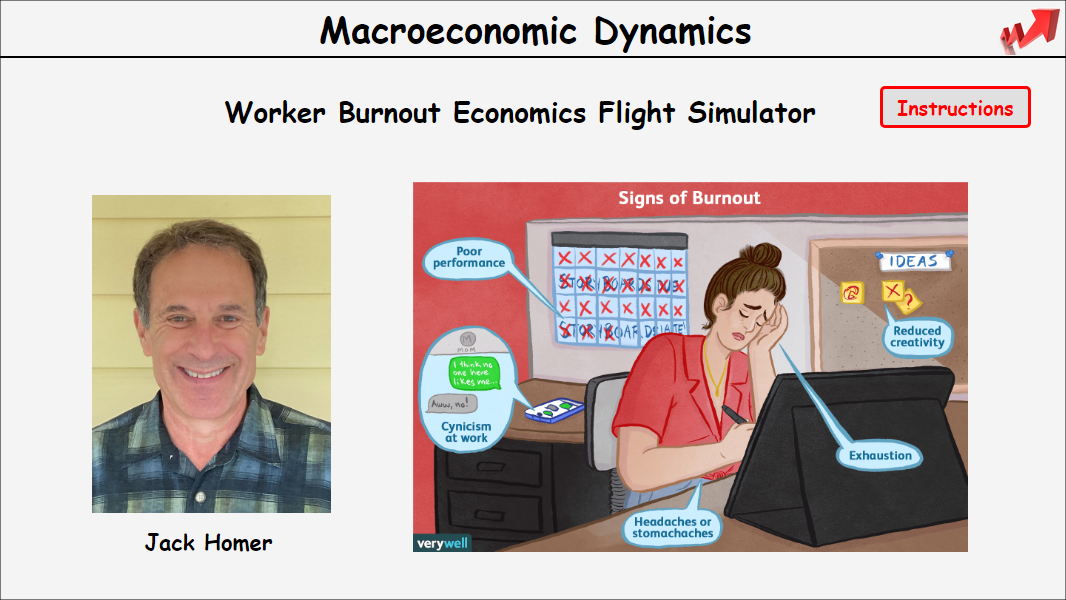
Homer's Worker Burnout Flight Simulator
sim
⋮ 4 runs
Health
#3

Samuelson's Multiplier-Accelerator Economics Flight Simulator
This is a system dynamics representation of Paul Samuelson's 1939 multiplier-accelerator model.
sim
⋮ 734 runs
Business
Economics
Education
#4
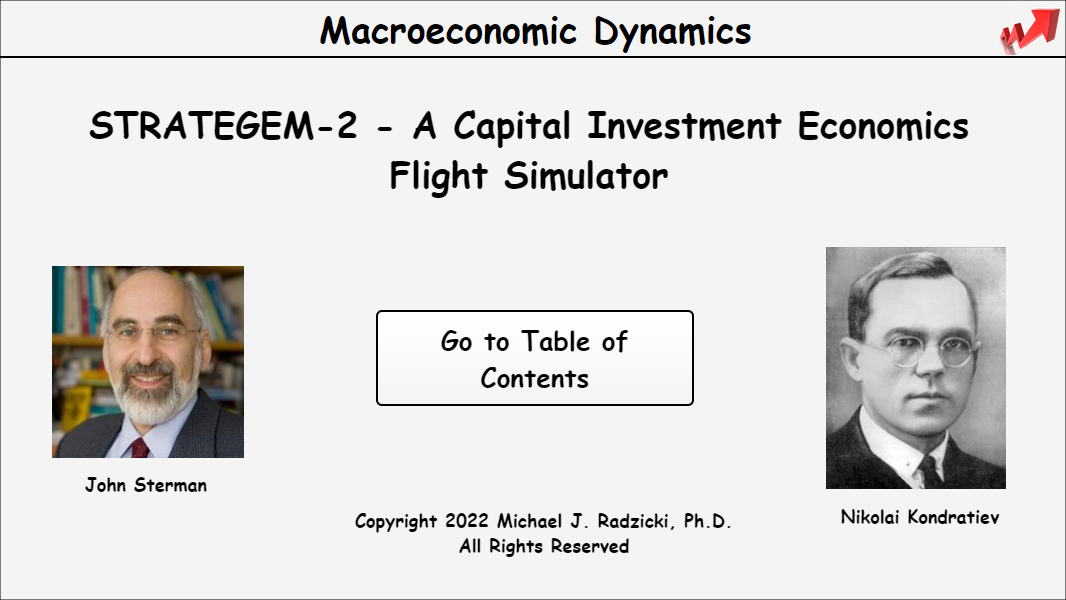
STRATEGEM-2 Economics Flight Simulator
sim
⋮ 930 runs
Economics
#5
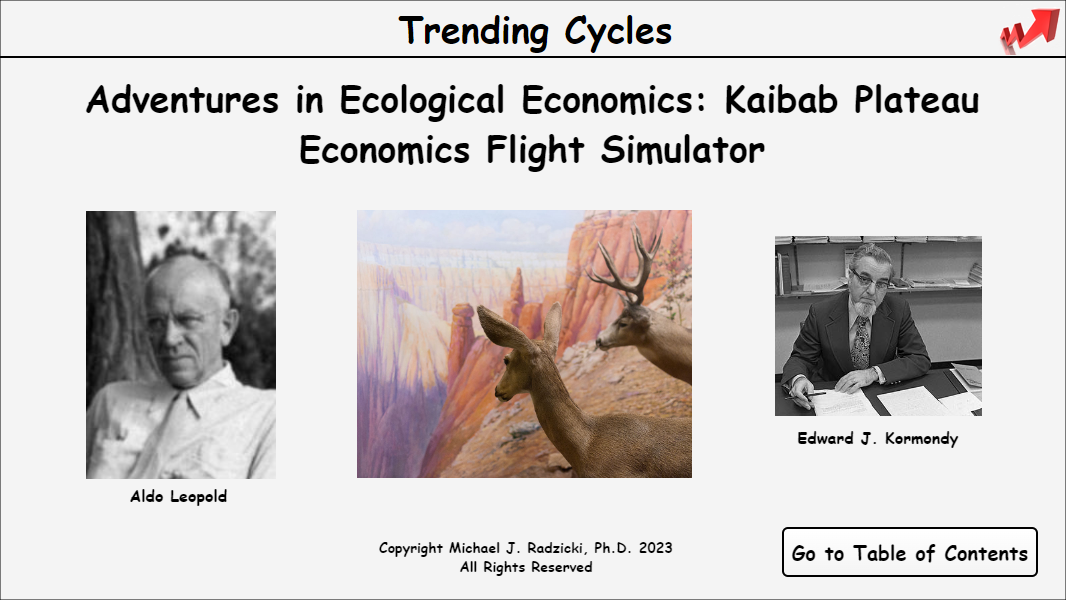
Kaibab Plateau Flight Simulator
sim
⋮ 3058 runs
Economics
Ecology
Education
#6
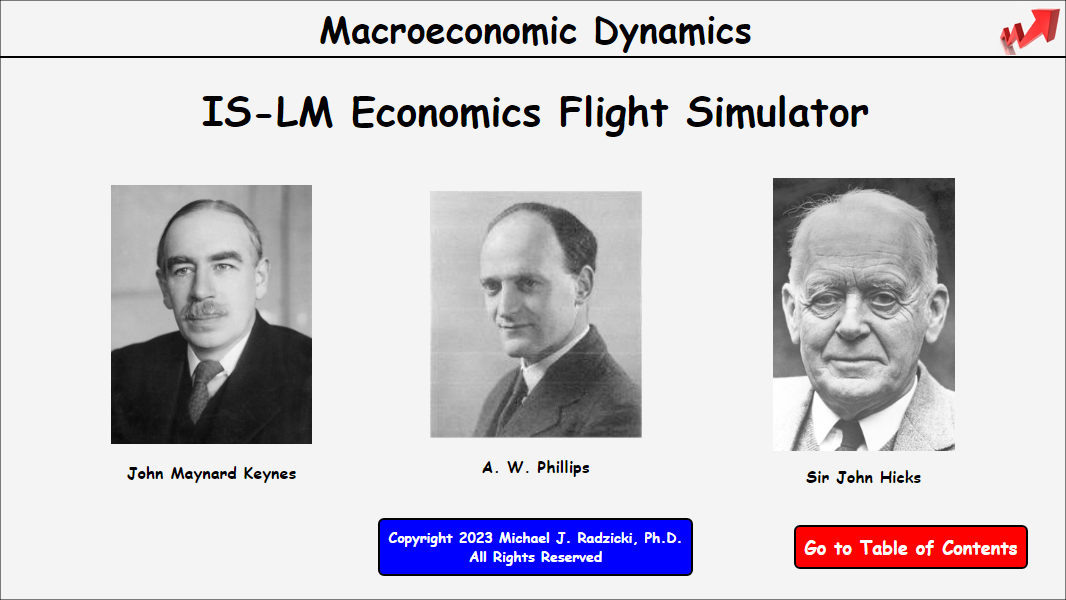
IS-LM Economics Flight Simulator
sim
⋮ 577 runs
Economics
#7
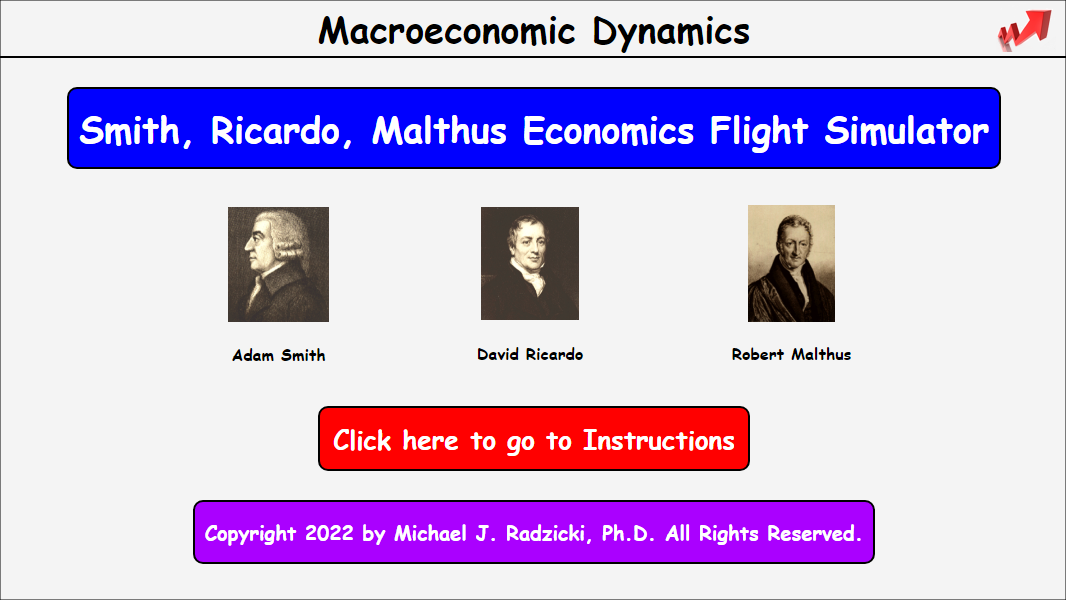
Smith-Ricardo-Malthus Economics Flight Simulator
sim
⋮ 1229 runs
Economics
#8
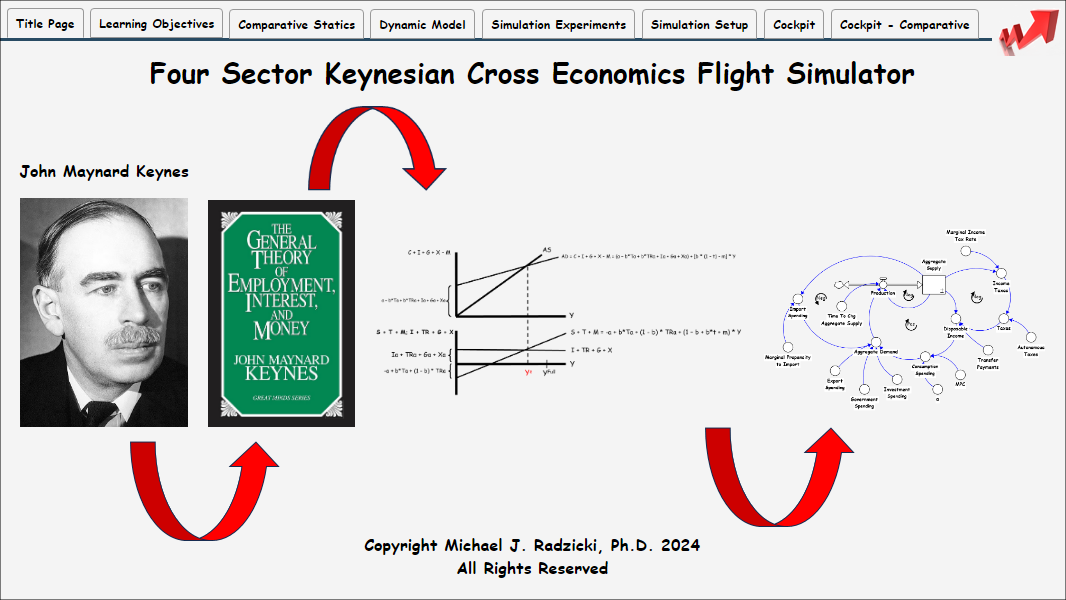
Four Sector Keynesian Cross Simulator
sim
⋮ 214 runs
Business
Economics
Education
#9
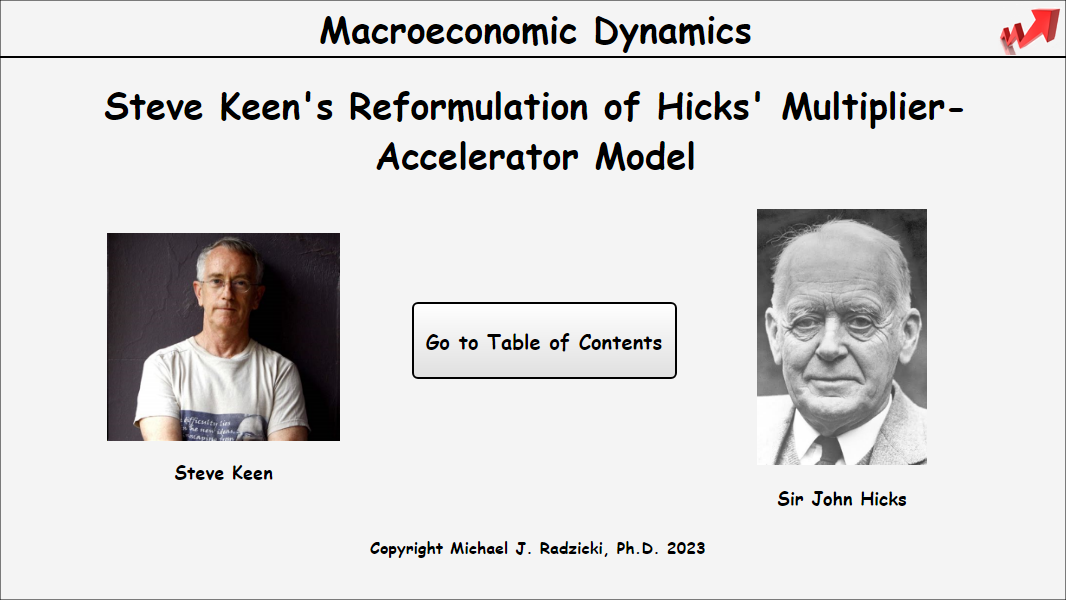
Keen-Hicks Multiplier-Accelerator Economics Flight Simulator
sim
⋮ 321 runs
Economics
Education
#10
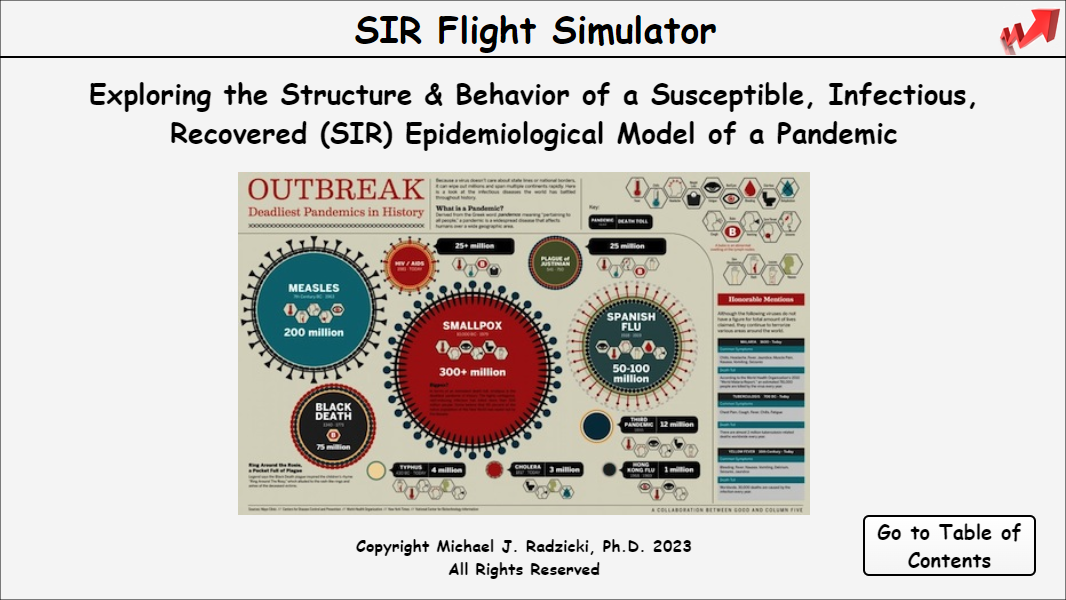
Pandemic Flight Simulator
sim
⋮ 2050 runs
Biology
Education
Health
#11
Student Workload Flight Simulator
sim
⋮ 3329 runs
Time Allocation; Psychology
#12
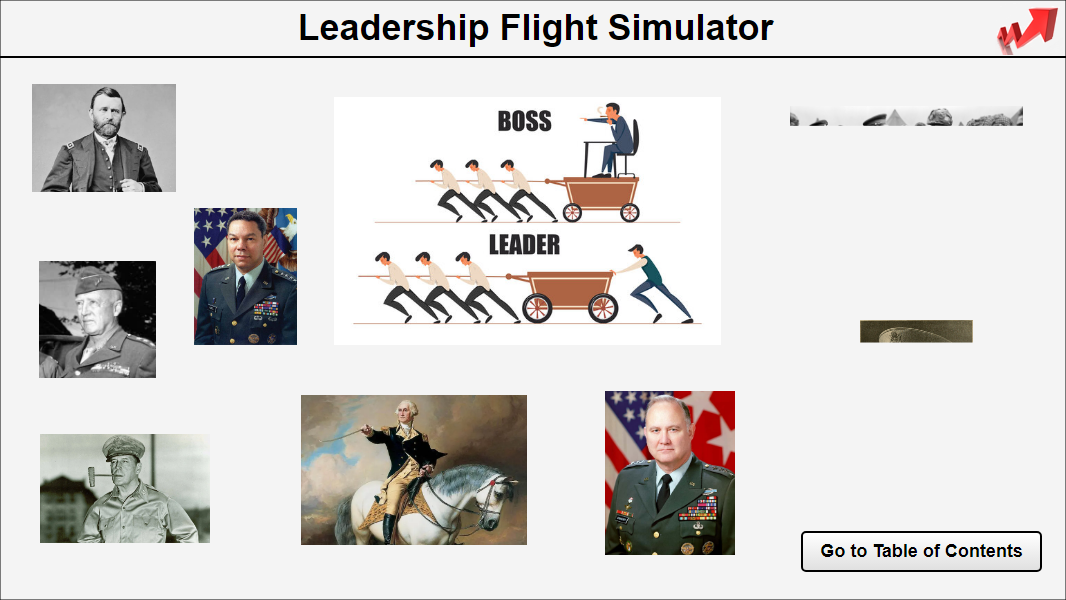
Leadership Flight Simulator
sim
⋮ 54 runs
Education
Leadership
Psychology
#13

Champagne - Leadership Simulator
sim
⋮ 609 runs
Health
Psychology
Leadership
#14
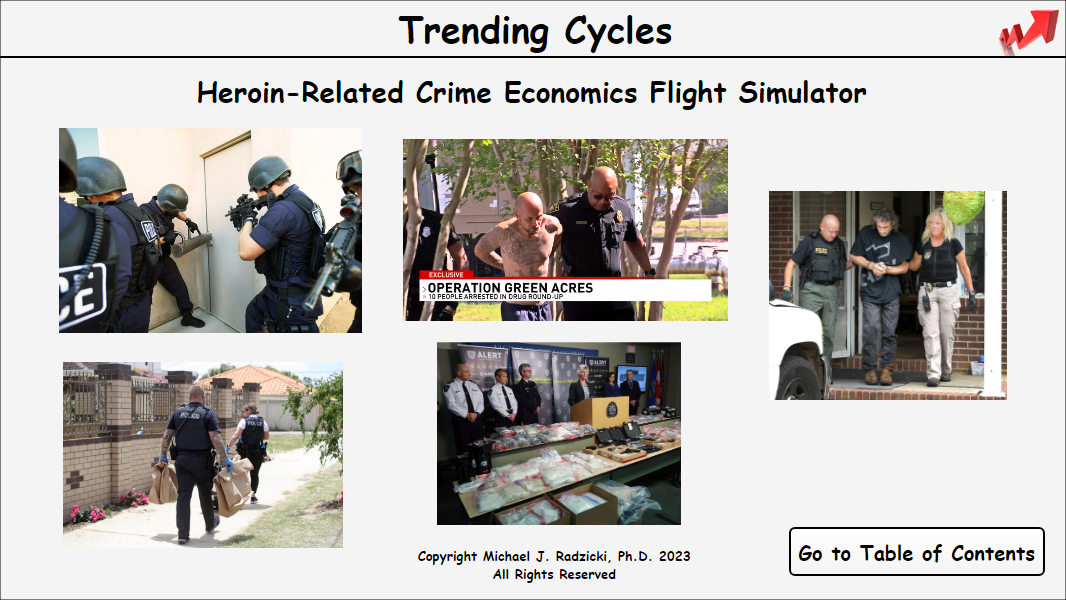
Heroin-Related Crime Flight Simulator
sim
⋮ 3427 runs
Economics
#15
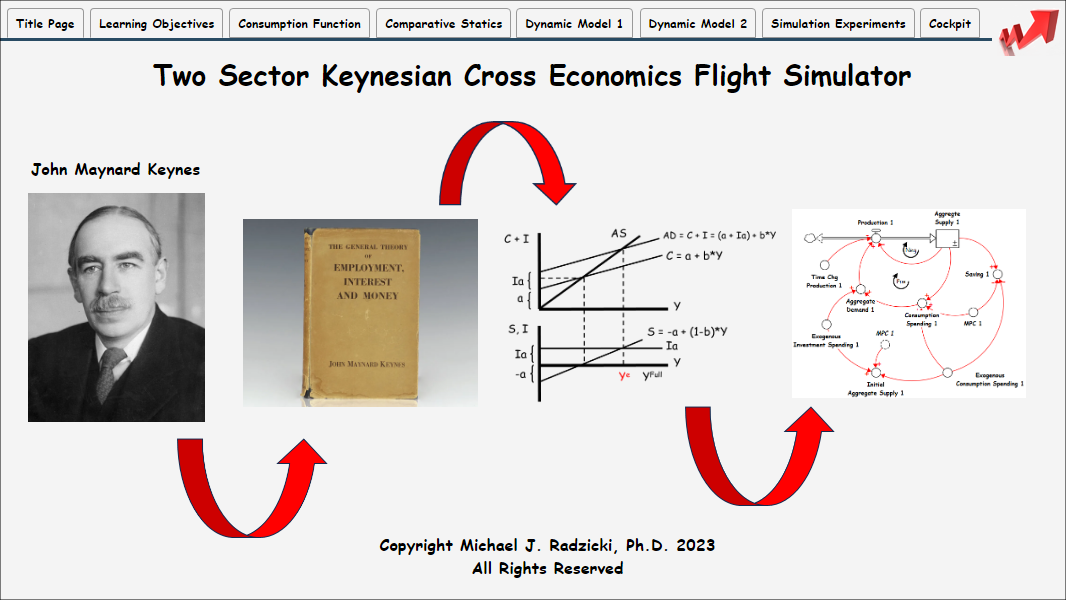
Two Sector Keynesian Cross Economics Flight Simulator
sim
⋮ 537 runs
Economics
Education
#16
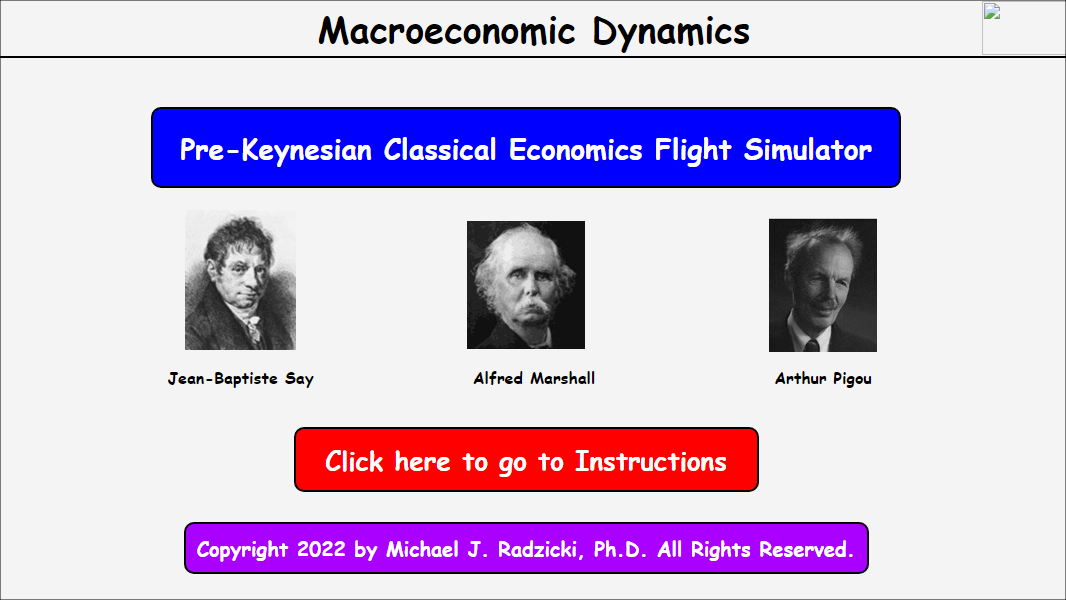
Pre-Keynesian Classical Economics Flight Simulator
This learning laboratory helps the user understand the economic thinking of the "classical economist
... Read more
This learning laboratory helps the user understand the economic thinking of the "classical economists" who were defined by Keynes to bo those who believed that Say's Law is true.
sim
⋮ 954 runs
Economics
#17
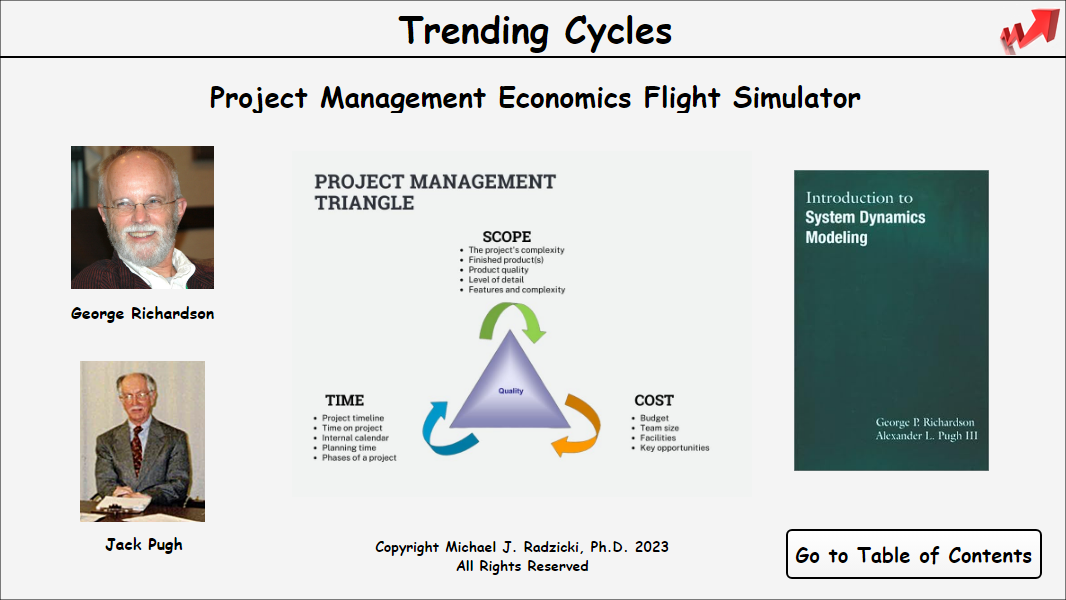
Project Management Eonomics Flight Simulator
sim
⋮ 9 runs
Business
Economics
#18
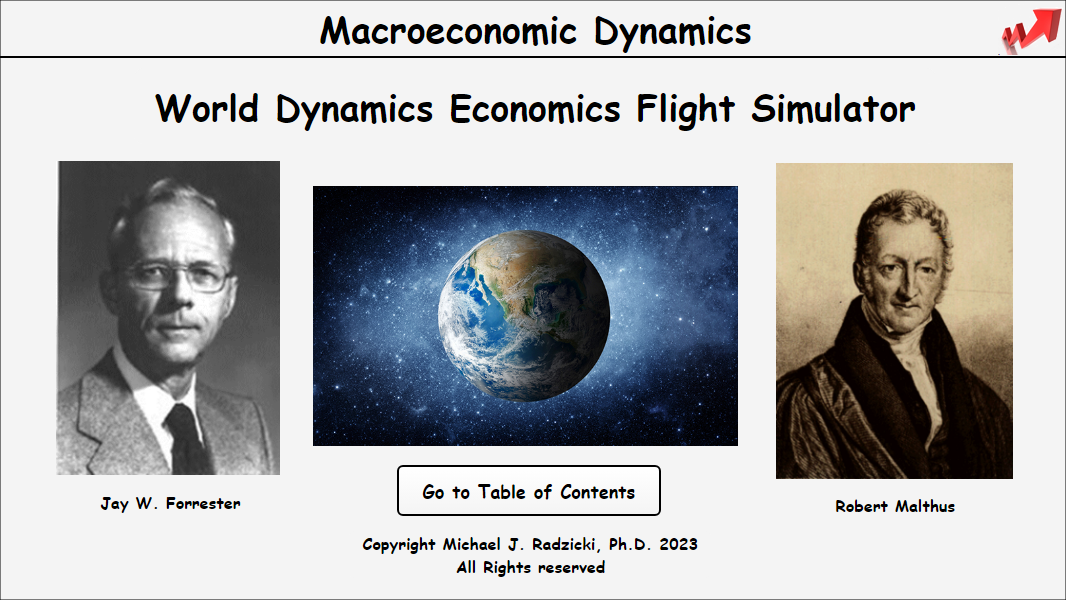
World Dynamics Economics Flight Simulator
sim
⋮ 9379 runs
Environment
Technology
Economics
Ecology
#19
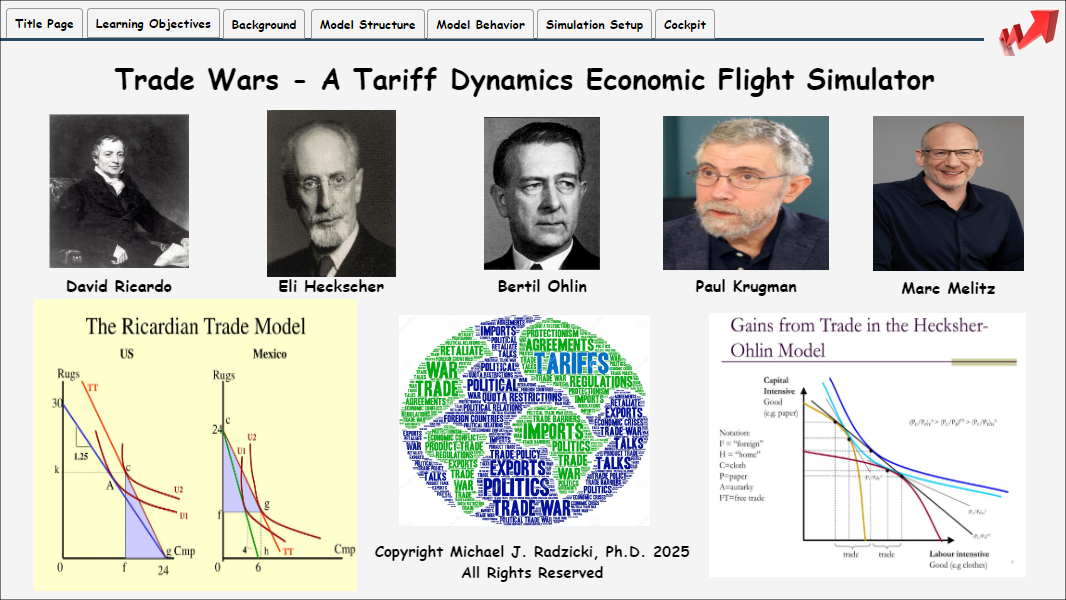
Tariff Wars Economic Flight Simulator
sim
⋮ 15 runs
Business
Economics
Uploading a Bundle from Zip
Instead of creating bundles, categories, and assemblies one by one, you can upload a single zip file that contains all of your bundle's content. To create your zipped bundle, make a folder with your bundle's name and add subfolders with your categories' names. The folder tree should have the same structure that you want the categories to have in your bundle. Place your assembly .stmx files in the appropriate category folders, then zip your bundle folder and upload it using the Upload Bundle from Zip link above.
Assemblies, Bundles, and Categories
Assemblies are self contained models that demonstrate common ways to connect together building blocks and that can be used as parts of other models. This is analogous to using prefabricated wall and roof pieces to construct a house.
Bundles are groups of assemblies with a common use or theme. For example, a Health Care bundle might contain a variety of assemblies that aid in creating health care models. When you download assemblies from the EconDynDev Sim Exchange, you download an entire bundle, rather than individual assemblies.
Categories are subgroups of assemblies within a bundle. For example, a Health Care bundle might contain a Funding category for assemblies related to the management of hospital funds. All assemblies must be assigned to a category—they cannot be assigned to the root of a bundle.
Assemblies, bundles, and categories can be created and uploaded to the EconDynDev Sim Exchange via the options on the Manage My Assemblies page. To learn more, visit our help pages, or take our assemblies tutorial.
Sim App (Sim)
An interface that allows users to interact with a model.
Sim apps allow users to interact with a model using buttons, sliders, knobs, tables, graphs, and storytelling. These interactions help users understand how parts of a system interact.
Interfaces are created by model authors in the Stella desktop software and can be uploaded to the EconDynDev Sim Exchange.
Model
A diagram that represents how elements in a system influence one another.
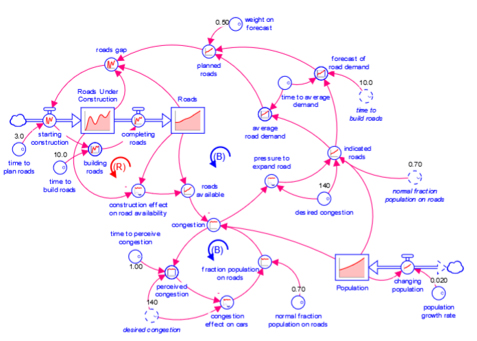
Models are mathematical representations of how elements in a system are connected and interact (e.g., ecosystems, organizations, supply chains). When running models on the EconDynDev Sim Exchange, results can be viewed in output devices like graphs and tables.
Models appear in the EconDynDev Sim Exchange directory when authors upload them from the Stella® desktop software or create them with Stella Online™.
Causal Loop Diagram (CLD)
A map that represents the feedback structure of a system.
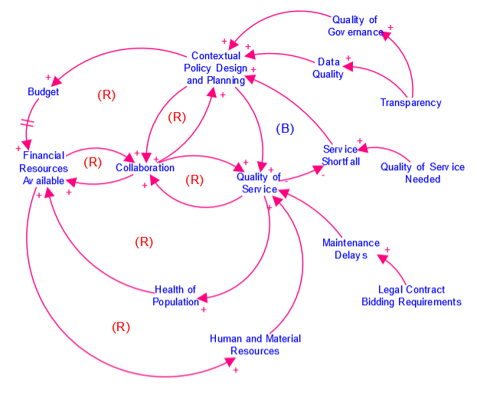
CLDs are high-level maps that represents the feedback structure of a system and easily communicate the essence of a model. They appear in the EconDynDev Sim Exchange when authors upload them from the Stella desktop software or create them with Stella Online™.